Basic analysis
CalcBasicStats
This routine computes a set of basic sample statistics, such as read counts, number of clonotypes, etc.
Command line usage
$VDJTOOLS CalcBasicStats \
[options] [sample1.txt sample2.txt ... if -m is not specified] output_prefix
Parameters:
| Shorthand | Long name | Argument | Description |
|---|---|---|---|
-m |
--metadata |
path | Path to metadata file. See Common parameters |
-u |
--unweighted |
If not set, all statistics will be weighted by clonotype frequency | |
-h |
--help |
Display help message |
Tabular output
The following table with .basicstats.txt suffix is generated,
| Column | Description |
|---|---|
| sample_id | Sample unique identifier |
| … | Metadata columns. See Metadata section |
| count | Number of reads in a given sample |
| diversity | Number of clonotypes in a given sample |
| mean_frequency | Mean clonotype frequency |
| geomean_frequency | Geometric mean of clonotype frequency |
| nc_diversity | Number of non-coding clonotypes |
| nc_frequency | Frequency of reads that belong to non-coding clonotypes |
| mean_cdr3nt_length | Mean length of CDR3 nucleotide sequence. Weighted by clonotype frequency |
| mean_insert_size | Mean number of inserted random nucleotides in CDR3 sequence. Characterizes V-J insert for receptor chains without D segment, or a sum of V-D and D-J insert sizes |
| mean_ndn_size | Mean number of nucleotides that lie between V and J segment sequences in CDR3 |
| convergence | Mean number of unique CDR3 nucleotide sequences that code for the same CDR3 amino acid sequence |
CalcSegmentUsage
This routine computes Variable (V) and Joining (J) segment usage vectors, i.e. the frequency of associated reads for each of V/J segments present in sample(s). If plotting is on, will also perform clustering for V/J usage vectors and samples à la gene expression analysis.
Command line usage
$VDJTOOLS CalcSegmentUsage \
[options] [sample1.txt sample2.txt ... if -m is not specified] output_prefix
Parameters:
| Shorthand | Long name | Argument | Description |
|---|---|---|---|
-m |
--metadata |
path | Path to metadata file. See Common parameters |
-u |
--unweighted |
Will compute the number of unique clonotypes with a given V/J segment. Counts the number of reads otherwise | |
-p |
--plot |
Turns on plotting. See Common parameters | |
-f |
--factor |
string | Specifies plotting factor. See Common parameters |
-n |
--numeric |
Specifies if plotting factor is numeric. See Common parameters | |
-l |
--label |
string | Specifies label used for plotting. See Common parameters |
-h |
--help |
Display help message |
Tabular output
The following tables with
.segments.[unwt or wt depending on -u parameter].[V or J].txt suffix
are generated,
| Column | Description |
|---|---|
| sample_id | Sample unique identifier |
| … | Metadata columns. See Metadata section |
| Segment name, e.g. TRBJ1-1 | Segment frequency in a given sample |
| Next segment name, e.g. TRBJ1-2 | … |
| … | … |
Graphical output
Images, having the same name as tables, with the exception of .pdf
extension, are created if plotting is on. They display segment usage
heatmap and hierarchical clustering for samples and segment.
This figure will be created using heatmap.2 function from gplots R package with default clustering parameters.
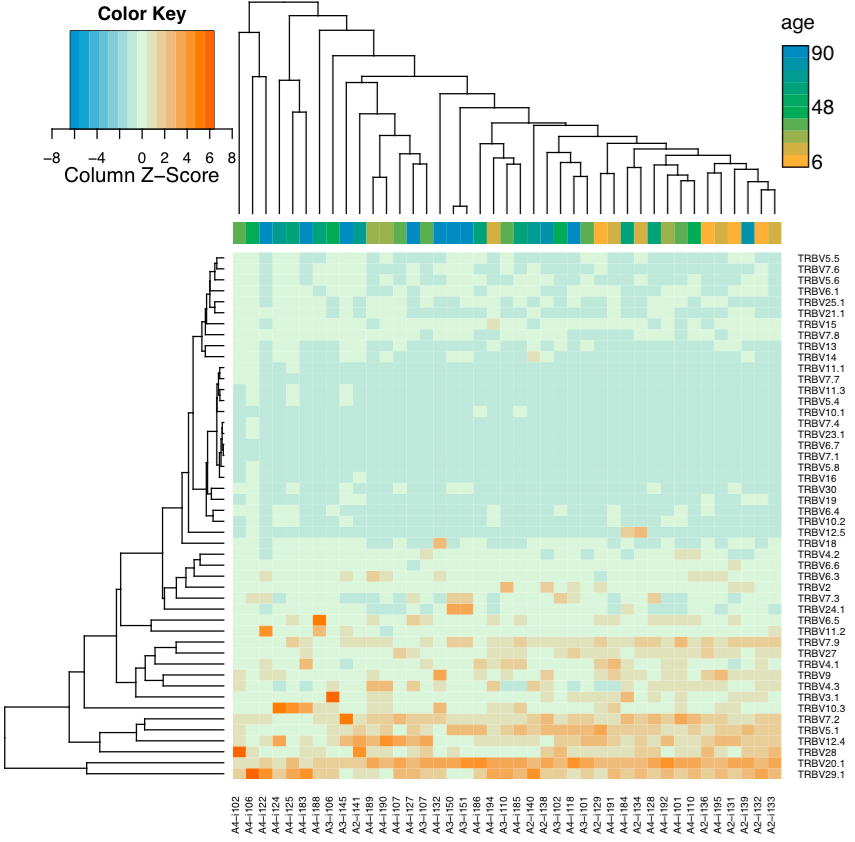
Sample clustering based on Variable segment usage. Weighted
Variable usage profiles are used, hierarchical clustering is
performed using euclidean distance. A continuous factor is displayed
(-n -f age argument).
CalcSpectratype
Calculates spectratype, that is, histogram of read counts by CDR3 nucleotide length. The spectratype is useful to detect pathological and highly clonal repertoires, as the spectratype of non-expanded T- and B-cells has a symmetric gaussian-like distribution.
Command line usage
$VDJTOOLS CalcSpectratype \
[options] [sample1.txt sample2.txt ... if -m is not specified] output_prefix
Parameters:
| Shorthand | Long name | Argument | Description |
|---|---|---|---|
-m |
--metadata |
path | Path to metadata file. See Common parameters |
-u |
--unweighted |
Instead of computing read frequency, will compute the number of unique clonotypes with specific a CDR3 length | |
-a |
--amino-acid |
Will use CDR3 amino acid sequences for calculation instead of nucleotide ones | |
-h |
--help |
Display help message |
Tabular output
The following table with
.spectratype.[aa or nt depending on -a parameter].[unwt or wt depending on -u parameter].txt
suffix is generated,
| Column | Description |
|---|---|
| sample_id | Sample unique identifier |
| … | Metadata columns. See Metadata section |
| CDR3 length, e.g. 22 | Frequency of reads with a given CDR3 length in a given sample |
| Next CDR3 length, 23 | … |
| … | … |
PlotFancySpectratype
Plots a spectratype that also displays CDR3 lengths for top N clonotypes in a given sample. This plot allows to detect the highly-expanded clonotypes.
Command line usage
$VDJTOOLS PlotFancySpectratype [options] sample.txt output_prefix
Parameters:
| Shorthand | Long name | Argument | Description |
|---|---|---|---|
-t |
--top |
int | Number of top clonotypes to visualize. Should not exceed 20, default is 10 |
-h |
--help |
Display help message |
Tabular output
Following table with .fancyspectra.txt prefix is generated,
| Column | Description |
|---|---|
| Len | Length of CDR3 nucleotide sequence |
| Other | Frequency of clonotypes with a given CDR3 length, other than top N |
| Clonotype#N, e.g. CASRLLRAGSTEAFF | Clonotype frequency, at the corresponding CDR3 length |
| Clonotype#N-1 | … |
| … | … |
Graphical output
The following image file with .fancyspectra.pdf suffix,
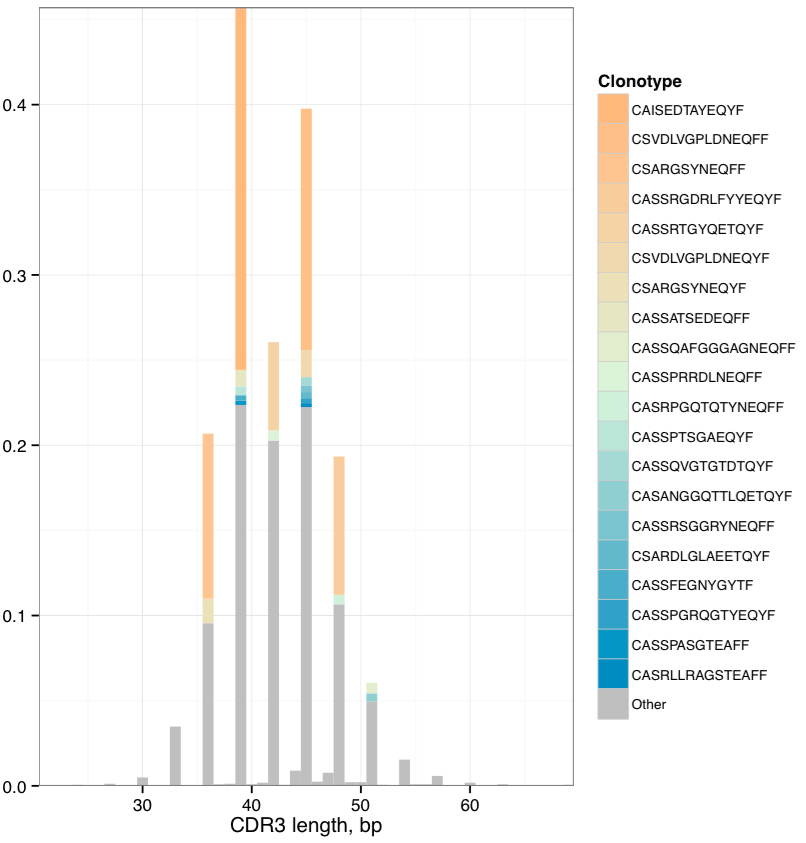
Spectratype with additional detalization. Most abundant clonotypes are explicitly shown.
PlotFancyVJUsage
Plots a circos-style V-J usage plot displaying the frequency of various V-J junctions.
Command line usage
$VDJTOOLS PlotFancyVJUsage [options] sample.txt output_prefix
Parameters:
| Shorthand | Long name | Argument | Description |
|---|---|---|---|
-u |
--unweighted |
Instead of computing read frequency, will compute the number of unique clonotypes with specific V-J junctions | |
-h |
--help |
Display help message |
Tabular output
A matrix with rows corresponding to different J segments and columns
corresponding to different V segments. Each cells contains the frequency
of a give V-J junction. The file has
.fancyvj.[unwt or wt depending on -u parameter].txt suffix.
Graphical output
An image having the same name as the output table, with the exception of
.pdf extension, is generated. The plot is built using
circlize R package.
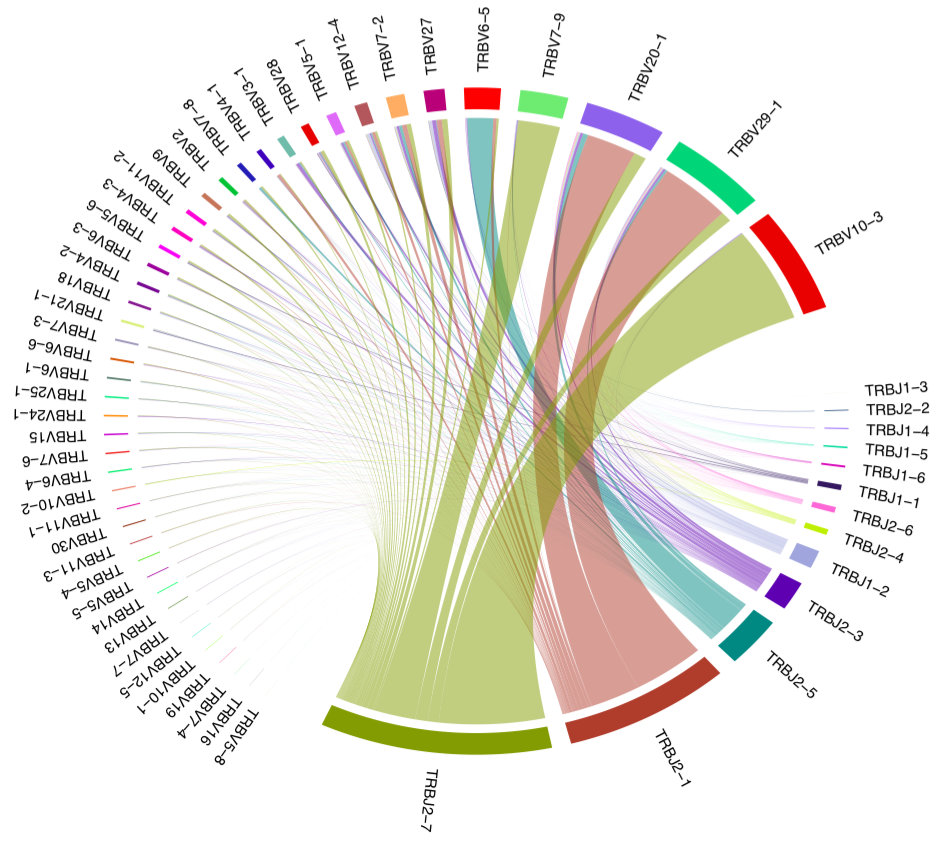
V-J junction circos plot for a single sample. Arcs correspond to different V and J segments, scaled to their frequency in sample. Ribbons represent V-J pairings and their size is scaled to the pairing frequency (weighted in present case).
PlotSpectratypeV
Plots a detailed spectratype containing additional info displays CDR3 length distribution for clonotypes from top N Variable segment families. This plot is useful to detect type 1 and type 2 repertoire biases, that could arise under pathological conditions.
Command line usage
$VDJTOOLS PlotSpectratypeV [options] sample.txt output_prefix
Parameters
| Shorthand | Long name | Argument | Description |
|---|---|---|---|
-t |
--top |
int | Number of top (by frequency) V segments to visualize. Should not exceed 12 default is 12 |
-u |
--unweighted |
Instead of counting read frequency, will count the number of unique clonotypes | |
-h |
--help |
Display help message |
Tabular output
Following table with
.spectraV.[unwt or wt depending on -u parameter].txt prefix is
generated,
| Column | Description |
|---|---|
| Len | Length of CDR3 nucleotide sequence |
| Other | Frequency of clonotypes with a given CDR3 length, having V segments other than the top N |
| Segment#N, e.g. TRBV10-1 | Frequency of clonotypes with a given V segment at the corresponding CDR3 length |
| Segment#N-1 | … |
| … | … |
Graphical output
The following image file with
.spectraV.[unwt or wt depending on -u parameter].pdf suffix,

Stacked spectratypes by Variable segment for a single sample. Most frequent Variable segments are highlighted.