Examples
There are several data bundles and shell scripts that cover most of VDJtools usage scenarios available in the examples repository.
All of the examples refer to a folder with clonotype abundance tables
(samples/). They contain a sample metadata file (metadata.txt,
see Metadata) and a shell script run.sh that contains a line-by-line
instructions to run various VDJtools routines. Sections below give
a detailed explanation for post-analysis steps for the available
example datasets.
For more details on individual VDJtools routines see the Analysis modules section.
Important
Samples in the repository are already converted to VDJtools format.
We assume that you have set the following variable pointing to VDJtools executable JAR file:
# Point to VDJtools executable and allocate enough memory for JVM
VDJTOOLS="java -Xmx20G -jar vdjtools.jar"
or in case the software was installed using Homebrew
VDJTOOLS="vdjtools -Xmx20G"
Aging
The aging experiment involving 39 healthy donors of various ages and both genders (see this paper for details). This example allows to have a look at how a diverse set of repertoire characteristics changes as we age. Post-analysis can be performed using the following commands:
# Basic analysis
# Generate summary tables
$VDJTOOLS CalcBasicStats -m metadata.txt out/0
$VDJTOOLS CalcSpectratype -m metadata.txt out/1
# -p for plotting, -f specifies metadata column for coloring,
# -n tells that factor is continuous
$VDJTOOLS CalcSegmentUsage -m metadata.txt -p -f age -n out/2
# the following routines run on a single sample
$VDJTOOLS PlotFancySpectratype ../samples/A4-i125.txt.gz out/3
$VDJTOOLS PlotSpectratypeV ../samples/A4-i125.txt.gz out/4
$VDJTOOLS PlotFancyVJUsage ../samples/A4-i125.txt.gz out/5

# Diversity estimation
# Plot clonality for a single sample
$VDJTOOLS PlotQuantileStats ../samples/A4-i125.txt.gz out/6
# Compute sample diversity estimates
$VDJTOOLS CalcDiversityStats -m metadata.txt out/7
# Perform rarefaction, -l specifies metadata column used as label
$VDJTOOLS RarefactionPlot -m metadata.txt -f age -n -l sample.id out/8

# Sample overlapping
# Overlap two replicate samples coming from the same donor
$VDJTOOLS OverlapPair -p ../samples/A4-i189.txt.gz ../samples/A4-i190.txt.gz out/9
# computes various metrics characterizing the similarity between repertoires
$VDJTOOLS CalcPairwiseDistances -m metadata.small.txt out/10
# plotting routine is separated from time-consuming batch intersection
# sample clustering is performed on this stage.
# Here we use relative sample overlap as metric and age as continuous factor
$VDJTOOLS ClusterSamples -p -f age -n -l sample.id out/10 out/10.age
# here we use Variable segment Jensen-Shannon divergence and sex as discrete factor
$VDJTOOLS ClusterSamples -p -e vJSD -f sex -l sample.id out/10 out/10.sex

# Demonstrate sample operations and filtering
# Remove cross-sample contamination (-c produces compressed output)
$VDJTOOLS Decontaminate -m metadata.txt -c out/dec/
# Down-sample datasets to 10,000 reads
$VDJTOOLS Downsample -m metadata.txt -c -x 10000 out/ds/
# Filter non-coding clonotypes
$VDJTOOLS FilterNonFunctional -m metadata.txt -c out/nf/
# Join samples into a single clonotype abundance matrix
$VDJTOOLS JoinSamples -p -m metadata.small.txt out/12
# Pool samples together
$VDJTOOLS PoolSamples -m metadata.small.txt out/13

# Annotate each clonotype in each sample with insert size,
# total CDR3 hydrophobicity and other basic and amino acid properties
$VDJTOOLS Annotate -m metadata.txt out/annot/
The code block above shows example usage for nearly all available commands.
Rarefaction plot in the aging case displays a strong age-related diversity decrease.
If running on a server with ~24GB of available RAM one can try out
repertoire clustering for the whole experiment (replace metadata.small.txt with
metadata.txt for corresponding routines) which will show some interesting age-related
trends.

Variable segment usage in healthy donors of various age. Note non-random sample grouping within dendrogram which can be attributed to stochastic antigen-driven expansion of clonotypes as we age. See CalcSegmentUsage for a detailed description of this plot.
HSCT
Hematopoietic stem cell transfer (HSCT) is a great model for clonotype tracking and studying how the diversity of immune repertoire restores following myeloablation. Post-analysis can be performed using the following commands:
# Some basic analysis, same as above
$VDJTOOLS CalcBasicStats -m metadata.txt out/0
$VDJTOOLS CalcSpectratype -m metadata.txt out/1
$VDJTOOLS CalcSegmentUsage -m metadata.txt -p -f "Time post HSCT, months" -n out/2

# Diversity estimates
# Note that selecting the factor having spaces in its name requires using double quotes
$VDJTOOLS CalcDiversityStats -m metadata.txt out/3
$VDJTOOLS RarefactionPlot -m metadata.txt -f "Time post HSCT, months" -n -l sample.id out/4

# Clonotype tracking
# Show repertoire changes that happen directly after HSCT
$VDJTOOLS OverlapPair -p ../samples/minus48months.txt.gz ../samples/4months.txt.gz out/5
# Next routine by default detects clonotypes that are present in 2 or more samples
# and builds a time course for them,
# but here we trace clonotypes from first time point setting -x 0
$VDJTOOLS TrackClonotypes -m metadata.txt -f "Time post HSCT, months" -x 0 -p out/6
RarefactionPlot output shows how repertoire diversity is lost and restored during post-HSCT period. The output of ScanDatabase (DEPRECATED since v1.0.5, use VDJmatch) displays that CMV- and EBV-specific clonotypes start to dominate in the repertoire: they comprise ~4% of repertoire prior to HSCT, but increase more than 2-fold in post-HSCT period.
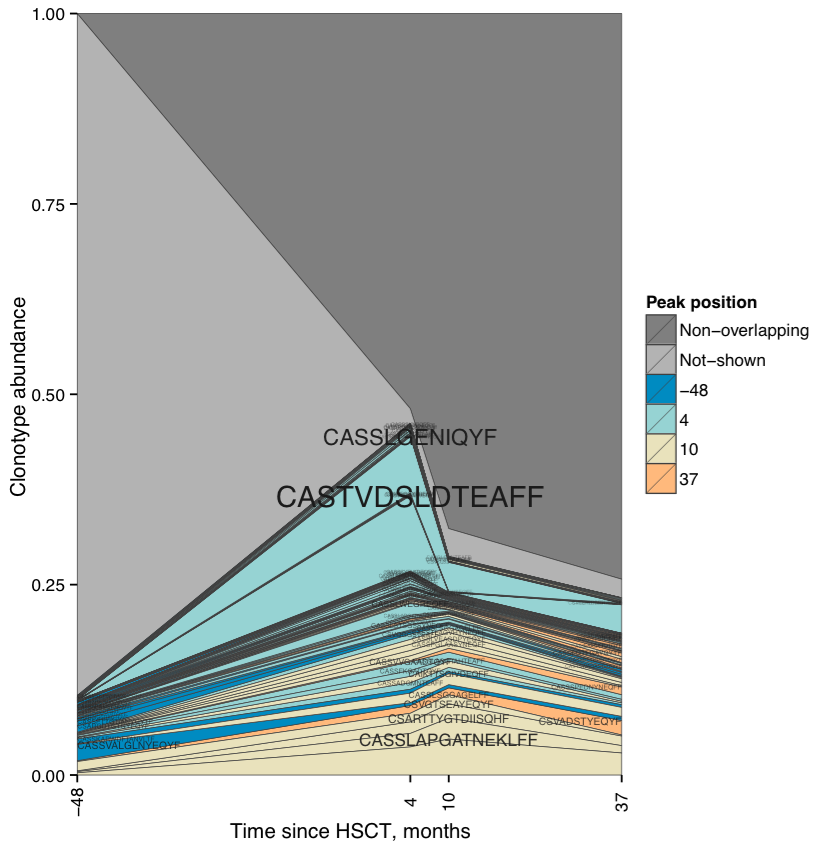
Clonotype abundance plot. Stacked abundance for top 100 clonotypes at different time points is shown.
Multiple sclerosis (MS)
MS is a complex autoimmune disorder that does not show a strong T-cell clonotype bias (see Turner et al.). Still some high-level repertoire features such as diversity and segment usage are distinct between affected persons and healthy donors.
# Diversity estimation
# Perform rarefaction analysis and compare repertoire diversity
# between MS patients and healthy donors
$VDJTOOLS RarefactionPlot -m metadata.txt -l sample_id -f state diversity/
$VDJTOOLS CalcDiversityStats -m metadata.txt diversity/

# Shows that MS cluster is not that compact as the
# cluster of healthy donors suggesting
# private nature of MS clonotypes
# -i aa!nt is used to discard CDR3 nucleotide sequence matches
    # (note the ! character should be escaped when running on Unix system: \!)
# and focus on amino-acid matches as strong cross-contamination is present
$VDJTOOLS CalcPairwiseDistances -i aa\!nt -m metadata.txt overlap/
$VDJTOOLS ClusterSamples -p -f state -i aa\!nt overlap/ overlap/state
$VDJTOOLS TestClusters -i aa\!nt overlap/state overlap/state

# Shows V usage level trends and cluster samples based on V usage profiles
$VDJTOOLS CalcSegmentUsage -m metadata.txt -p -f state vusage/

# Shows details of repertoire changes for MS8 patient that has
# undergone a HSCT (MS14 is a post-HSCT blood sample)
$VDJTOOLS OverlapPair -p ../samples/MS8.txt.gz ../samples/MS14.txt.gz overlap/
$VDJTOOLS PlotFancyVJUsage ../samples/MS8.txt.gz hsct/MS8
$VDJTOOLS PlotFancyVJUsage ../samples/MS14.txt.gz hsct/MS8-HSCT
Below is an example of RarefactionPlot graphical output.
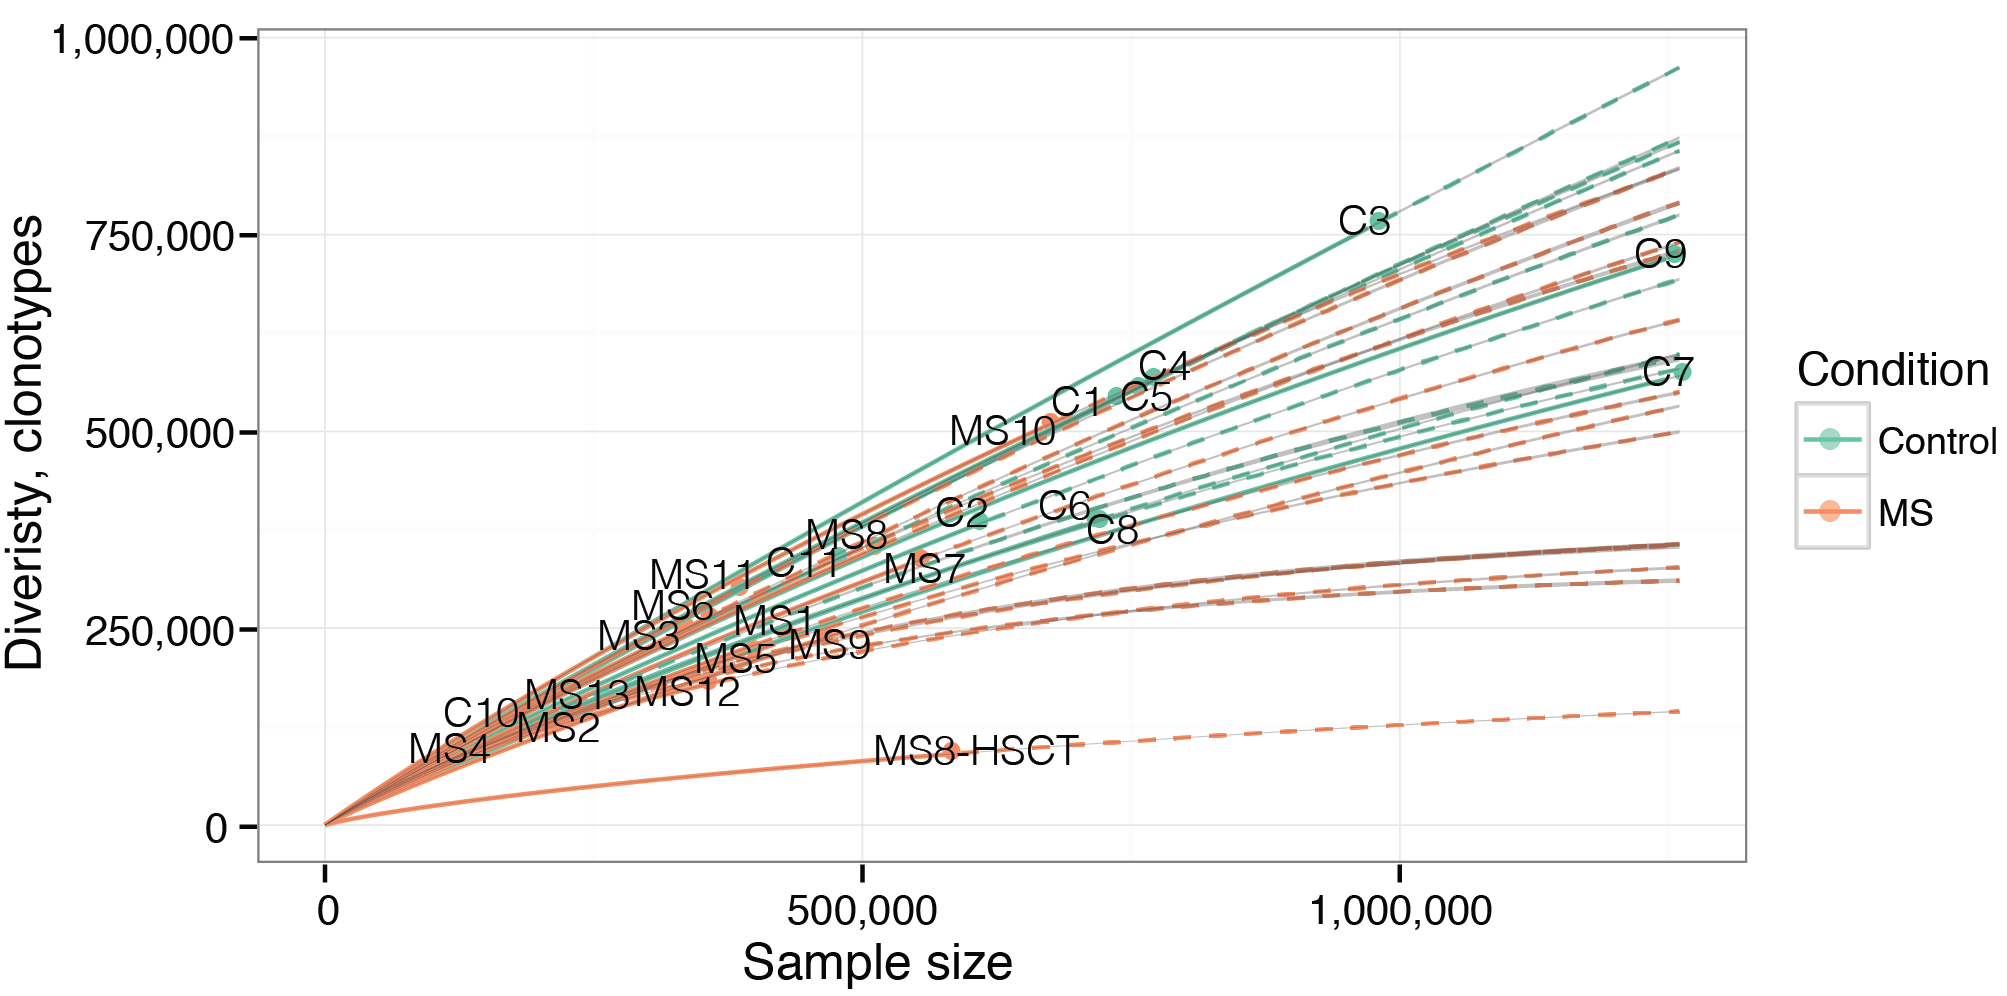
Rarefaction analysis of MS and healthy donor repertoires. Note that rarefaction curves for MS patients are generally lower than those for healthy donors, indicating the presence of clonal expansion in former.