Repertoire overlap analysis
OverlapPair
Performs a comprehensive analysis of clonotype sharing for a pair of samples.
Command line usage
$VDJTOOLS OverlapPair [options] sample1.txt sample2.txt output_prefix
Parameters:
| Shorthand | Long name | Argument | Description |
|---|---|---|---|
-i |
--intersect-type |
string | Sample intersection rule. Defaults to strict. See Common parameters |
-t |
--top |
int | Number of top clonotypes to visualize explicitly on stack are plot and provide in the collapsed joint table. Should not exceed 100, default is 20 |
-p |
--plot |
Turns on plotting. See Common parameters | |
--plot-area-v2 |
Alternative plotting mode, clonotype CDR3 sequences are shown at plot sides and connected to corresponding areas with lines. | ||
-h |
--help |
Display help message |
Tabular output
Two joint clonotype abundance tables with
paired.[intersection type shorthand].table.txt and
paired.[intersection type shorthand].table.collapsed.txt suffices
are generated. Tables are written in VDJtools format.
Collapsed table contains rows corresponding to top N clonotypes and
summary abundances for non-overlapping and hidden clonotypes.
See Joint clonotype abundance table structure for a detailed description of table columns.
A summary table (paired.[intersection type shorthand].summary.txt
suffix) containing information on sample overlap size, etc, is also
provided. See tabular output in CalcPairwiseDistances section
below for details.
Graphical output
A composite scatterplot plot having
paired.[intersection type shorthand].scatter.pdf suffix is
generated. The second plot file with
.paired.[intersection type shorthand].table.collapsed.pdf suffix
contains a clonotype stack area plot.
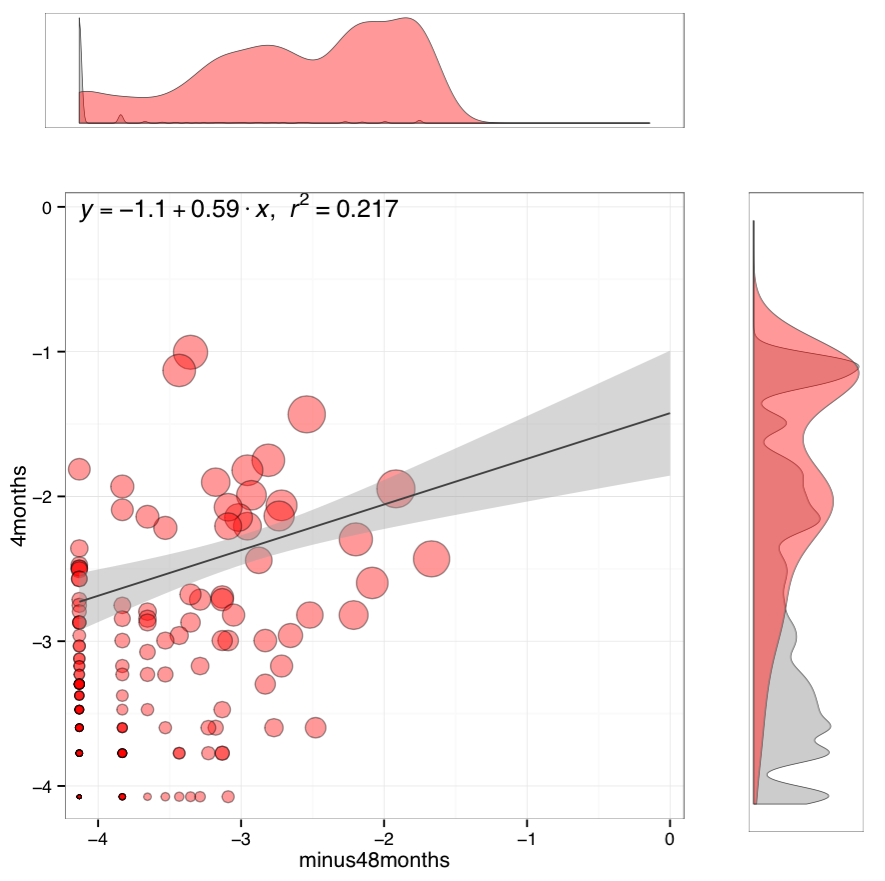
Clonotype scatterplot. Main frame contains a scatterplot of clonotype abundances (overlapping clonotypes only) and a linear regression. Point size is scaled to the geometric mean of clonotype frequency in both samples. Scatterplot axes represent log10 clonotype frequencies in each sample. Two marginal histograms show the overlapping (red) and total clonotype (grey) abundance distributions in corresponding sample. Histograms are weighted by clonotype abundance, i.e. they display read distribution by clonotype size.
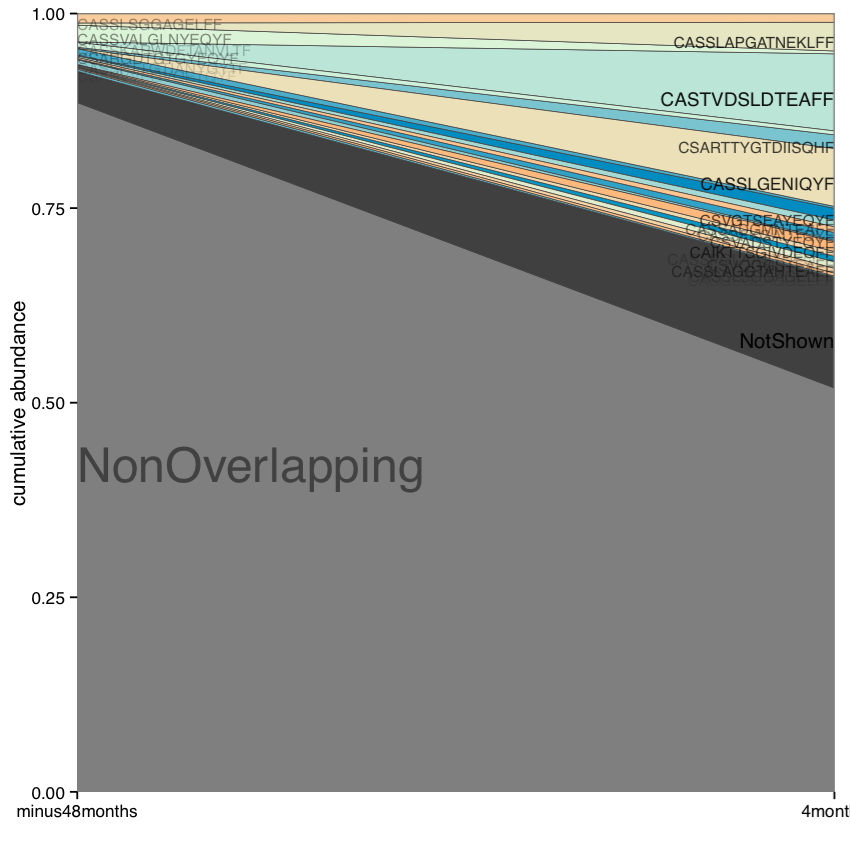
Shared clonotype abundance plot. Plot shows details for top 20 clonotypes shared between samples, as well as collapsed (“NotShown”) and non-overlapping (“NonOverlapping”) clonotypes. Clonotype CDR3 amino acid sequence is plotted against the sample where the clonotype reaches maximum abundance.
CalcPairwiseDistances
Performs an all-versus-all pairwise overlap for a list of samples
and computes a set of repertoire similarity measures. At least 3 samples
should be provided. Note that this is one of most the memory-demanding routines,
as it will load all samples into memory at once (unless used with --low-mem option).
Repertoire similarity measures include
Pearson correlation of clonotype frequencies, restricted only to the overlapping clonotypes
\[R_{ij} = \frac{\sum^N_{k=1} \left(\phi _{ik} - \bar{\phi _{i}} \right ) \left(\phi _{jk} - \bar{\phi _{j}} \right )}{\sqrt{\sum^N_{k=1} \left(\phi _{ik} - \bar{\phi _{i}} \right )^2 \sum^N_{k=1} \left(\phi _{jk} - \bar{\phi _{j}} \right )^2}}\]where \(k=1..N\) are the indices of overlapping clonotypes, \(\phi_{ik}\) is the frequency of clonotype \(k\) in sample \(i\) and \(\bar{\phi_{i}}\) is the average frequency of overlapping clonotypes in sample \(i\).
Relative overlap diversity, computed with the following normalization
\[D_{ij} = \frac{d_{ij}}{d_{i}d_{j}}\]where \(d_{ij}\) is the number of clonotypes present in both samples and \(d_{i}\) is the diversity of sample \(i\). See this paper for the rationale behind normalization.
Geometric mean of relative overlap frequencies
\[F_{ij} = \sqrt{f_{ij}f_{ji}}\]where \(f_{ij}=\sum^N_{k=1}\phi_{ik}\) is the total frequency of clonotypes that overlap between samples \(i\) and \(j\) in sample \(i\).
Сlonotype-wise sum of geometric mean frequencies
\[F2_{ij} = \sum^N_{k=1}\sqrt{\phi_{ik}\phi_{jk}}\]Note that this measure performs similar to \(F\) and provides slightly more robust results in case cross-sample contamination is present.
Jensen-Shannon divergence between Variable segment usage profiles (will be moved to CalcSegmentUsage in near future).
ClusterSamples routine can be additionally run for CalcPairwiseDistances results.
Command line usage
$VDJTOOLS CalcPairwiseDistances \
[options] [sample1.txt sample2.txt sample3.txt ... if -m is not specified] output_prefix
Parameters:
| Shorthand | Long name | Argument | Description |
|---|---|---|---|
-m |
--metadata |
path | Path to metadata file. See Common parameters |
-i |
--intersect-type |
string | Sample intersection rule. Defaults to aa. See Common parameters |
--low-mem |
Low memory mode, will keep only a pair of samples in memory during execution, but run much slower. | ||
-p |
--plot |
Turns on plotting. See Common parameters | |
-h |
--help |
Display help message |
Tabular output
A table suffixed
intersect.batch.[intersection type shorthand].summary.txt with a
comprehensive information on sample pair intersections is generated.
This table is non-redundant: it contains N * (N - 1) / 2 rows
corresponding to upper diagonal of matrix of possible pairs (i,j).
Table layout is given below in three parts.
General info
| Column | Description |
|---|---|
| 1_sample_id | First sample unique identifier |
| 2_sample_id | Second sample unique identifier |
| div1 | Total number of clonotypes in the first sample after identical clonotypes are collapsed based on intersection type -i |
| div2 | Same as above, second sample |
| div12 | Number of overlapping clonotypes |
| div21 | Same as above |
| count1 | Total number of reads in the first sample |
| count2 | … |
| count12 | For clonotypes overlapping between two samples: total number of reads they have in the first sample |
| count21 | … |
| freq1 | Total clonotype relative abundance for the first sample (should be 1.0 if sample is unaltered) |
| freq2 | … |
| freq12 | For clonotypes overlapping between two samples: their sum of relative abundances in the first sample |
| freq21 | … |
Overlap metrics
| Column | Description |
|---|---|
| R | Pearson correlation |
| D | Relative overlap diversity |
| F | Geometric mean of relative overlap frequencies |
| F2 | Sum of geometric means of overlapping clonotype frequencies. |
| vJSD | Jensen-Shannon divergence of Variable segment usage distributions |
| vjJSD | <experimental> |
| vj2JSD | <experimental> |
| sJSD | <experimental> |
| Jaccard | Jaccard index |
| MorisitaHorn | Morisita-Horn index |
Sample metadata
| Column | Description |
|---|---|
| 1_… | First sample metadata columns. See Metadata section |
| 2_… | Second sample metadata columns |
Graphical output
Circos plots showing pairwise overlap are stored in a file suffixed
intersect.batch.[intersection type shorthand].summary.pdf.

Pairwise overlap circos plot. Count, frequency and diversity panels correspond to the read count, frequency (both non-symmetric) and the total number of clonotypes that are shared between samples. Pairwise overlaps are stacked, i.e. segment arc length is not equal to sample size.
ClusterSamples
This routine provides additional cluster analysis (hierarchical clustering), multi-dimensional scaling (MDS) and plotting for CalcPairwiseDistances output.
Note that this routine requires the following parameter setting:
- Input file prefix (
input_prefix) is set to the same value as the output prefix of CalcPairwiseDistances - The
-iargument setting is the same as in CalcPairwiseDistances
Command line usage
$VDJTOOLS ClusterSamples \
[options] input_prefix [output_prefix]
Parameters:
| Shorthand | Long name | Argument | Description |
|---|---|---|---|
-e |
--measure |
string | Sample overlap metric, see Overlap metrics section of CalcPairwiseDistances tabular output for allowed values. Defaults to F |
-i |
--intersect-type |
string | Intersection type, defaults to aa. See Common parameters |
-f |
--factor |
string | Specifies metadata column with plotting factor (is used to color for sample labels and figure legend). See Common parameters |
-n |
--numeric |
Specifies if plotting factor is continuous. See Common parameters | |
-l |
--label |
string | Specifies metadata column with sample labelslabel . See Common parameters |
-h |
--help |
Display help message | |
-p |
--plot |
Turns on plotting. See Common parameters |
Tabular output
Two output files are generated:
- Table suffixed
mds.[value of -i argument].[value of -e argument].txtthat contains coordinates of samples computed using multi-dimensional scaling (MDS), i.e. the coordinates of samples projected to a 2D plane in a manner that pairwise sample distances are preserved. - A file in Newick format suffixed
hc.[value of -i argument].[value of -e argument].newickis generated that contains sample dendrogram produced by hierarchical clustering.
Note
Hierarchical clustering and MDS are performed using hclust() and
isoMDS() (MASS package) R functions.
Default parameters are used for those algorithms.
Distances are scaled as -log10(.) and (1-.)/2 for relative overlap and
correlation metrics respectively; in case of Jensen-Shannon divergence,
Jaccard and Morisita-Horn indices no scaling is performed.
Graphical output
Hierarchical clustering plot is stored in a file suffixed
hc.[value of -i argument].[value of -e argument].pdf.
MDS plot is stored in a file with
mds.[value of -i argument].[value of -e argument].pdf suffix.
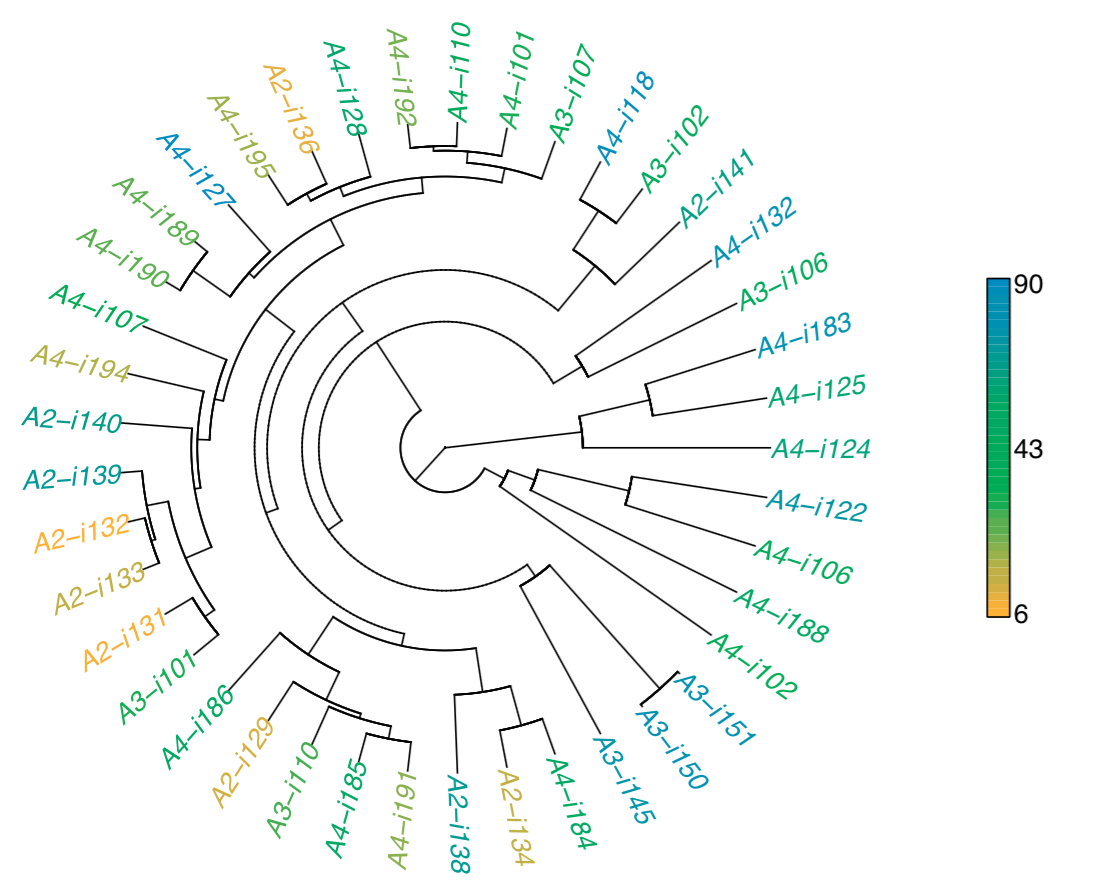
Hierarchical clustering. Dendrogram of samples, branch
length shows the distance between repertoires. Node colors
correspond to factor value, continuous scale is used in
present case (-n -f age argument).
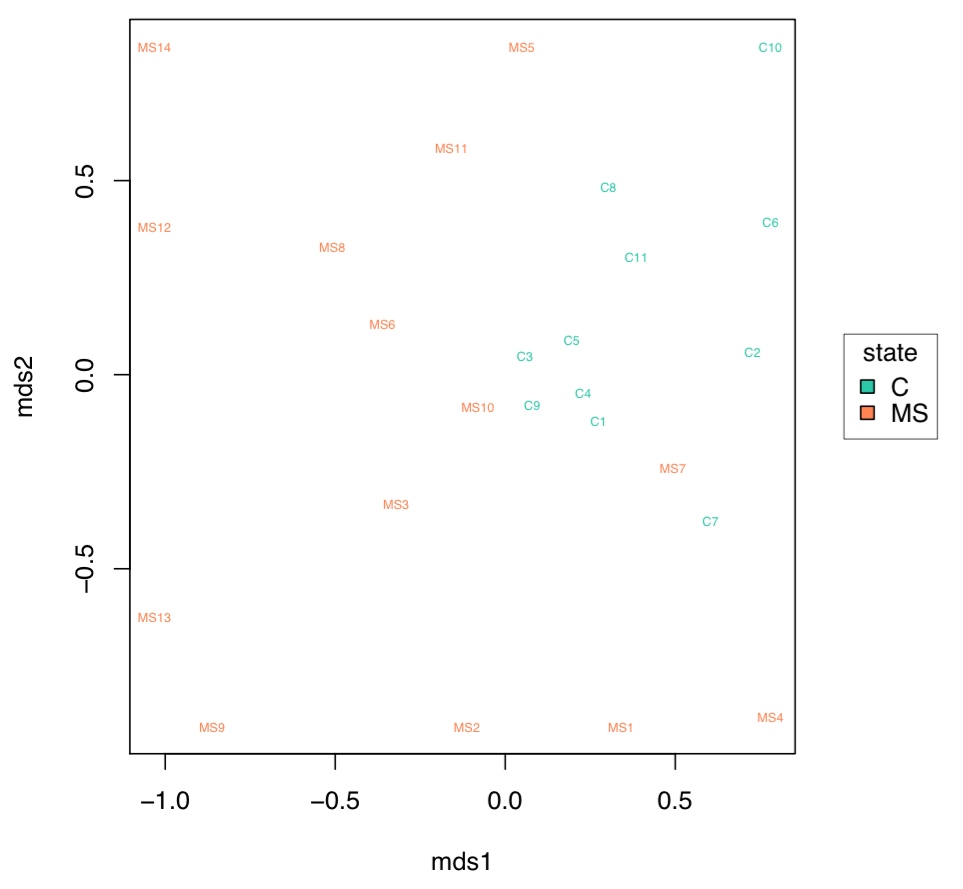
MDS plot. A scatterplot of samples. Euclidean distance between points reflects the distance between repertoires. Points are colored by factor value.
TestClusters
This routine allows to test whether a given factor influences repertoire clustering. It assesses compactness of samples that have the same factor level and separation between samples with distinct factor levels for the factor specified in ClusterSamples.
Performs post-hoc permutation testing
based on MDS coordinates generated by ClusterSamples routine.
Can only be performed if a discrete factor (-f) was specified
in ClusterSamples.
Note that this routine requires the following parameter setting:
- Input file prefix (
input_prefix) is set to the same value as the output prefix of ClusterSamples - The
-iand-eargument setting is the same as in ClusterSamples
Command line usage
$VDJTOOLS TestClusters \
[options] input_prefix [output_prefix]
Parameters:
| Shorthand | Long name | Argument | Description |
|---|---|---|---|
-e |
--measure |
string | Sample overlap metric, see Overlap metrics section of CalcPairwiseDistances tabular output for allowed values. Defaults to F |
-i |
--intersect-type |
string | Intersection type, defaults to aa. See Common parameters |
Tabular output
none
Graphical output
Permutation summary plot is generated having the
perms.[value of -i argument].[value of -e argument].pdf suffix.
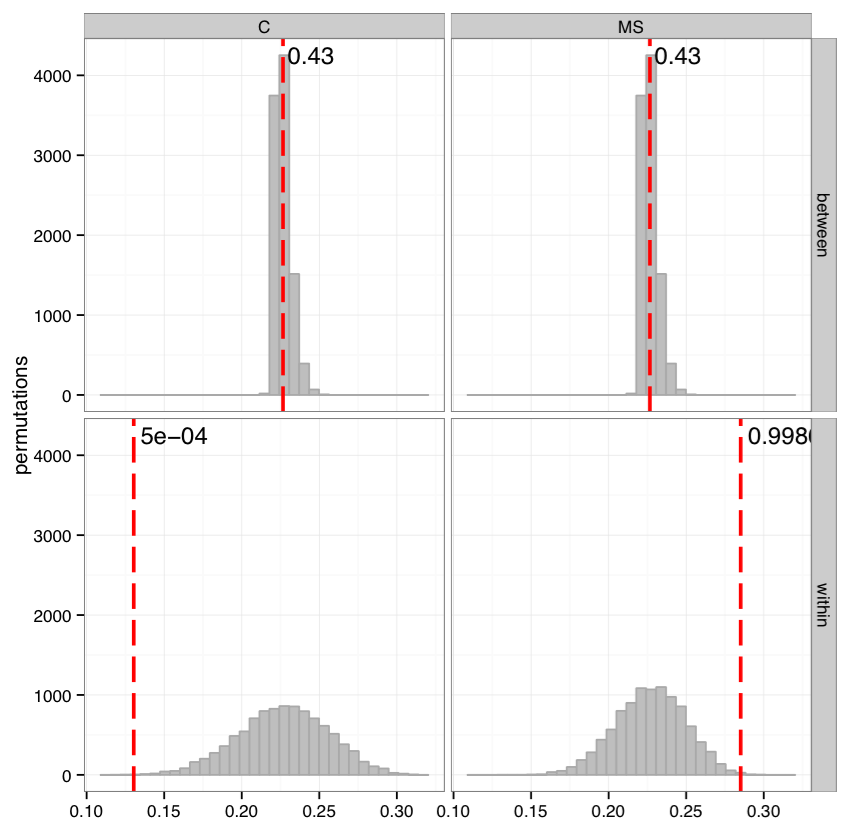
Testing compactness and separation of sample clustering for a given factor. Average repertoire similarity values for sample pairs in which both samples have the same (within panel) and different (between panel) factor levels. Each row correspond to a specific factor level. Red lines show observed values, histograms correspond to values generated by randomly permuting factor levels. Numbers near red lines indicate P-values for n=10000 permutations.
TrackClonotypes
This routine performs an all-vs-all intersection between an ordered list of samples for clonotype tracking purposes. User can specify sample which clonotypes will be traced, e.g. the pre-therapy sample.
Command line usage
$VDJTOOLS TrackClonotypes \
[options] [sample1.txt sample2.txt sample3.txt ... if -m is not specified] output_prefix
Parameters:
| Shorthand | Long name | Argument | Description |
|---|---|---|---|
-m |
--metadata |
path | Path to metadata file. See See Common parameters |
-i |
--intersect-type |
string | Sample intersection rule. Defaults to strict. See Common parameters |
-f |
--factor |
string | Specifies factor that should be treated as time variable. Factor values should be numeric. If such column not set, time points are taken either from values provided with -s argument or sample order. See Common parameters |
-x |
--track-sample |
integer | A zero-based index of time point to track. If not provided, will consider all clonotypes that were detected in 2+ samples |
-s |
--sequence |
[t1,t2,...] |
Time point sequence. Unused if -m is specified. If not specified, either time column values from metadata, or sample indexes (as in command line) are used. |
-t |
--top |
integer | Number of top clonotypes to visualize explicitly on stack are plot and provide in the collapsed joint table. Should not exceed 100, default is 200 |
-p |
--plot |
Turns on plotting. See Common parameters | |
-c |
--compress |
Compressed output for clonotype table. See Common parameters | |
-h |
--help |
Display help message |
Tabular output
Summary table suffixed sequential.[value of -i argument].summary.txt
is created with the following columns.
| Column | Description |
|---|---|
| 1_sample_id | First sample unique identifier |
| 2_sample_id | Second sample unique identifier |
| value | Value of the intersection metric |
| metric | Metric type: diversity, frequency or count. Metrics correspond to the number of unique clonotypes, total frequency and total read count for clonotypes overlapping between first and second sample. In case tracking is on (-x), only clonotypes present in tracked sample are counted. |
| 1_time | Time value for the first sample |
| 2_time | Time value for the second sample |
| 1_… | First sample metadata columns. See Metadata section |
| 2_… | Second sample metadata columns |
Two joint clonotype abundance tables with
sequential.[intersection type shorthand].table.txt and
sequential.[intersection type shorthand].table.collapsed.txt
suffices are generated. The latter contains top -t
clonotypes, with two additional rows containing summary count and frequency
for non-overlapping and collapsed clonotypes.
See Joint clonotype abundance table structure for a detailed description of table columns.
Graphical output
Summary table is visualized in a plot file suffixed
sequential.[value of -i argument].summary.pdf.
A plot file with .sequential.[value of -i argument].stackplot.pdf
suffix contains a clonotype abundance stack area plot.
The same is also visualized using a heatmap in a file with
.sequential.[value of -i argument].heatplot.pdf).
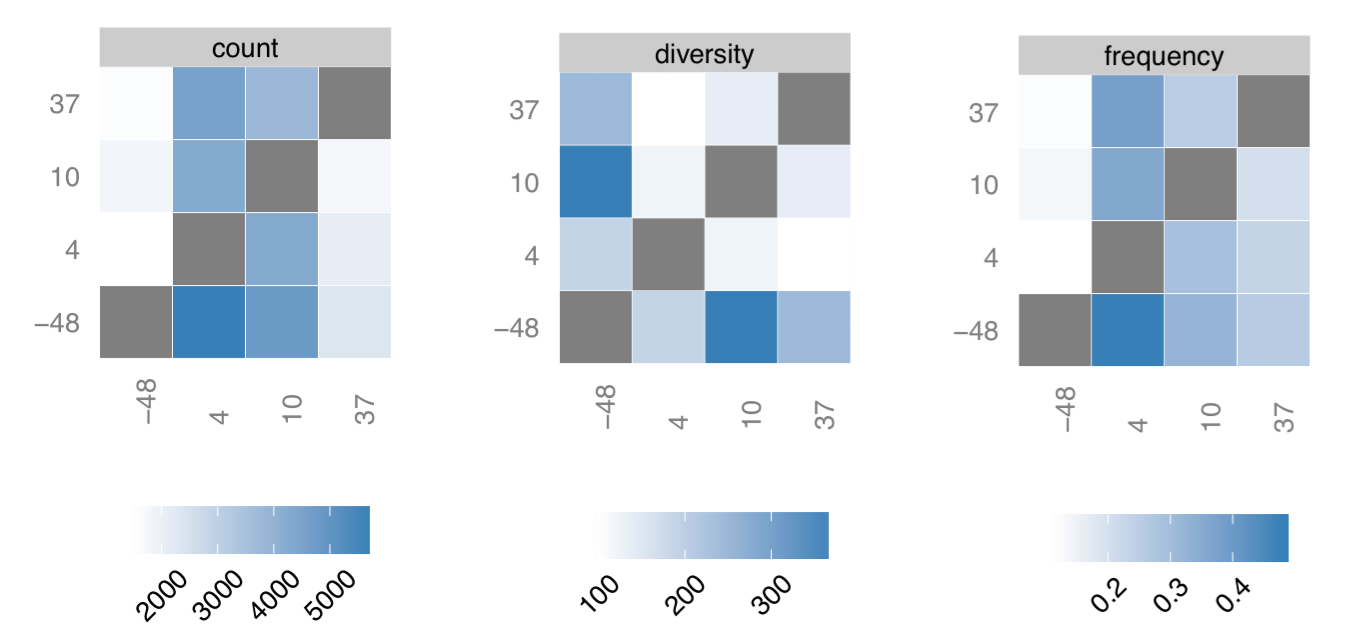
Clonotype tracking summary. Count, frequency and diversity panels correspond to the read count, frequency (both non-symmetric) and the total number of clonotypes that are shared between samples. Rows and columns of each matrix are sorted according to time point sequence.
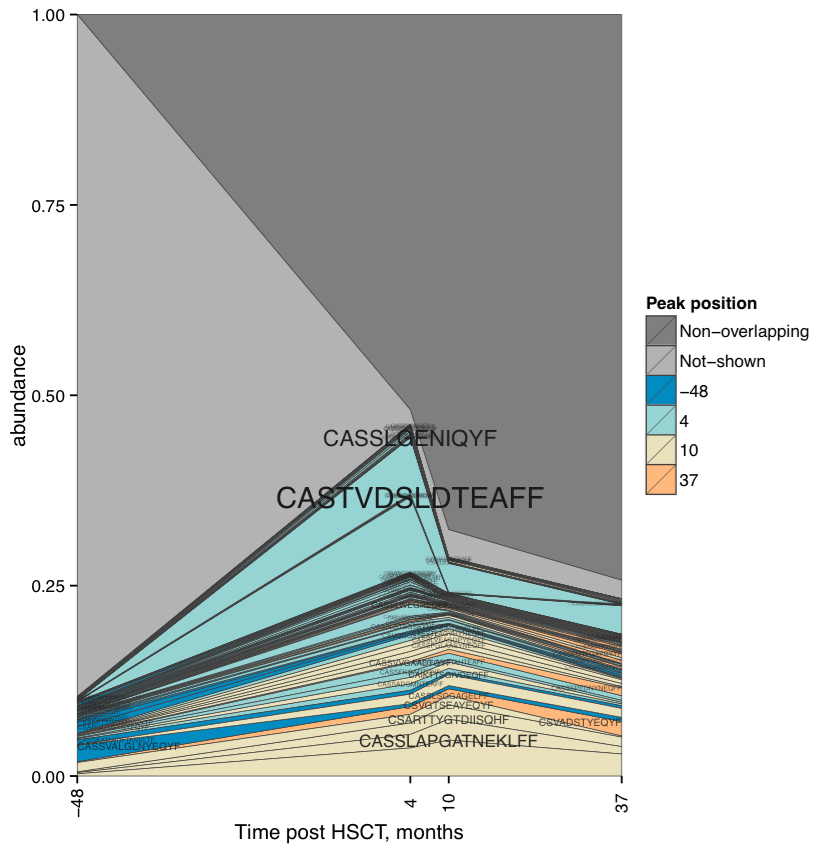
Clonotype tracking stackplot. Contains detailed profiles for top
-t clonotypes, as well as collapsed (“NotShown”) and non-overlapping
(“NonOverlapping”) clonotypes. Clonotype CDR3 amino acid sequence is
plotted against the sample where the clonotype reaches maximum
abundance. Clonotypes are colored by the peak position of their
abundance profile.
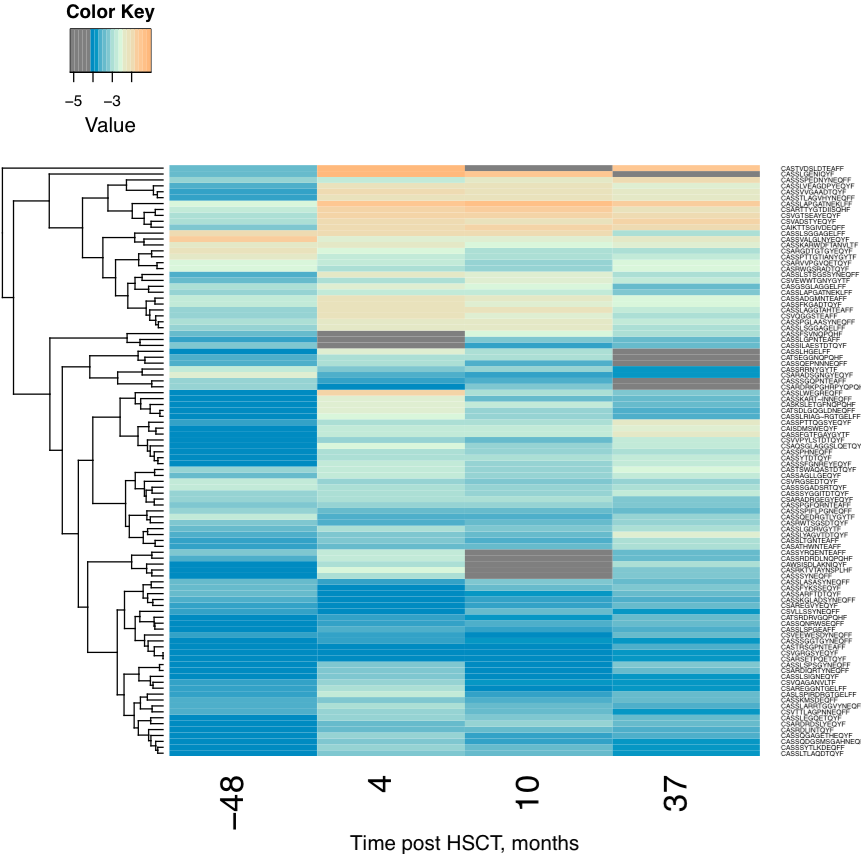
Clonotype tracking heatmap. Shows a heatmap for top -t
joint clonotype abundances.